A frequent question in support e-mails is related to overlaying a plot with another, particularly for different plot types, e.g. overlaying a 3D surface plot with an XY plot. This feature has been a long time in making and still has a few issues (see below), but yes you can do this with the OverlayDocument macro command or, if you're a developer, by sending the OverlayDocument command to DPlot via the DPlot_Command function in dplotlib.dll. This feature is only available in DPlot versions 2.2 and later.
Syntax:
OverlayDocument(docnum|,alpha|maskcolor||) or
OverlayDocument("caption"|,alpha|,maskcolor||)
In the first form, docnum is the 1-based document index of the plot you want to draw on top of the currently active plot. This value corresponds to the indices you'll see for open documents on the Window menu.
In the second form, "caption" is the title of that plot, shown in the document title bar. If this form is used then the caption must be delineated with quotation marks, as shown.
The optional alpha parameter controls the transparency of the overlay. alpha=0 is completely transparent (invisible, in other words); alpha=255 is opaque (no transparency).
The maskcolor argument specifies a color (red+green*256+blue*65536, or hex 0x00bbggrr) in the overlay that will not be drawn if alpha is between 0 and 255. This is useful for making opaque portions of the overlay transparent: in particular an opaque legend box or contour line labels with an opaque background. This feature does not work particularly well with anti-aliased lines and/or smoothed screen fonts, since you can only specify a single color. Antialiased lines and fonts are generally less of a problem with printed plots.
If you aren't familiar with DPlot macros, there really isn't all that much to it, so don't be scared off just yet. To create a macro select the Macro command on the File menu. Type a name for the macro that you'll remember next week in the Macro Name box, then click Edit/Create. We'll start with something simple: if you have 2 open documents, document 1 is active and you want to overlay it with document 2, type:
OverlayDocument(2)
in the macro editor window, click the Save button, then the Run button.
Example:
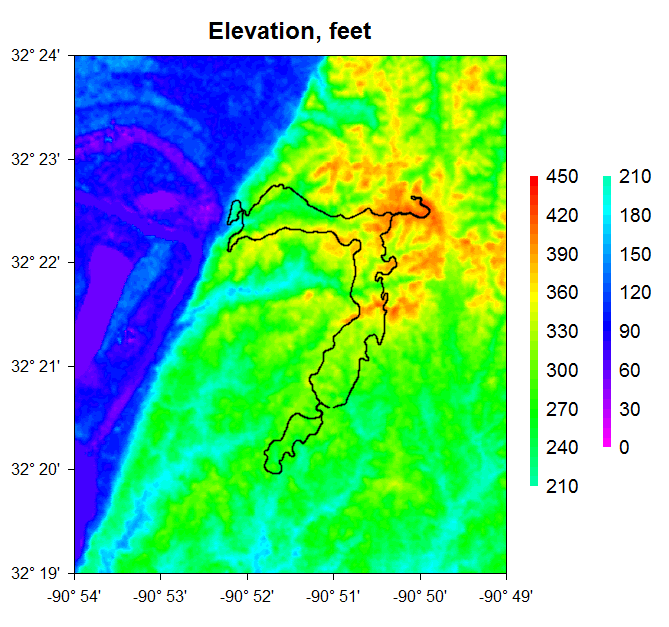
Document 1 is a surface plot of the Vicksburg National Military Park area created from NASA SRTM data:

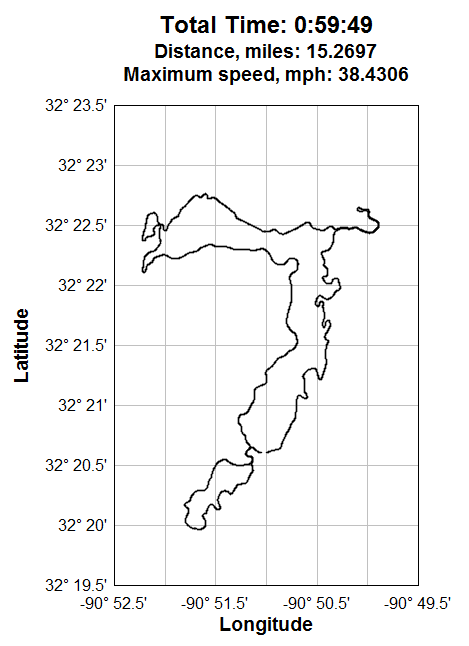
Document 2 is an XY plot created from a Garmin GPS device during a bike ride through that same park:
With document 1 active, the macro command OverlayDocument(2) results in:
This feature hasn't been added to the normal menu commands in DPlot simply because there are several quirks to work out yet. Namely: transparency may (or may not) work correctly in printed plots, depending on your printer. Multiple axes in the overlay plot are not transferred to the overlaid plot. Other than the data itself, most plot features for the overlay plot are ignored: title lines, axis labels, number formatting, etc. These are all necessary and won't likely change. But the legend for a surface plot is also omitted for (currently) the same reason, and there is no way to show that legend. At least some of these limitations will likely be worked out in a future release.
This feature is not intended for use with 3D views of 3D/4D data at this time, though DPlot will not prevent you from using it on those plot types.