|
ContourView macro command |

  
|
|
ContourView macro command |
|
Macro commands may be used either in macros or by sending the commands to DPlot via dynamic data exchange (DDE). Some commands are valid only in macros (noted by Macros Only). Commands sent to DPlot via DDE must be enclosed by square brackets [ ]. Macro commands should not include the brackets.
Command parameters shown in the descriptions below are placeholders for the actual values. Command parameters are either numeric values, equations that evaluate to numbers, or character strings. Character string parameters are always bound by double quotation marks. Equations must be preceded by an equals sign (=).
The pipe symbol (|) in the command syntax indicates that a parameter is optional, and should not be included in your macro unless otherwise noted.
All indices into arrays are 1-based, e.g. Curve1=1 refers to the first curve in a plot.
A 0x prefix for numbers in the descriptions below indicates hexadecimal notation; e.g. 0x0010 = 16.
![]() JR/Viewer indicates that the command is supported by DPlot Jr or DPlot Viewer.
JR/Viewer indicates that the command is supported by DPlot Jr or DPlot Viewer.
![]() JR/Viewer indicates that the command is NOT supported by DPlot Jr or DPlot Viewer.
JR/Viewer indicates that the command is NOT supported by DPlot Jr or DPlot Viewer.
[ContourView(azimuth,elevation,perspective)] |
|
Sets the view angles for a 3D contour plot and the range from the viewpoint to the center of the surface for perspective projections. All arguments are optional and must be separated by a comma. Angles are specified in degrees. If perspective is not greater than 0, a normal orthographic projection is drawn (no perspective correction). To draw the plot in a 3D projection, use Contour3D. This command is equivalent to the Azimuth, Elevation, and Perspective settings on the Contour Options dialog box.
Example:
[ContourView(,30)]
leaves the azimuth and perspective at their current values and sets the elevation angle to 30 degrees.
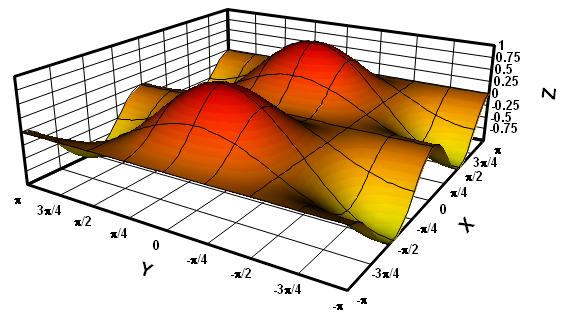
The perspective value is a multiplier for one-half the diagonal of the imaginary box surrounding the plot. Values greater than 0 and less than 1 are forced to the minimum of 1.0. A value of 1 places the viewpoint on the imaginary smallest sphere that encompasses the plot. Generally this value will produce a very distorted plot. Best results are usually achieved with a value of 2 or more.
Perspective examples:
[ContourView(30,20,0)]
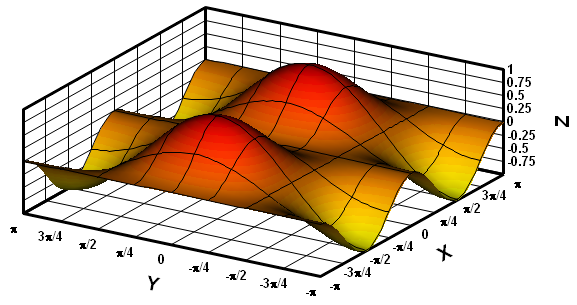
[ContourView(30,20,2)]
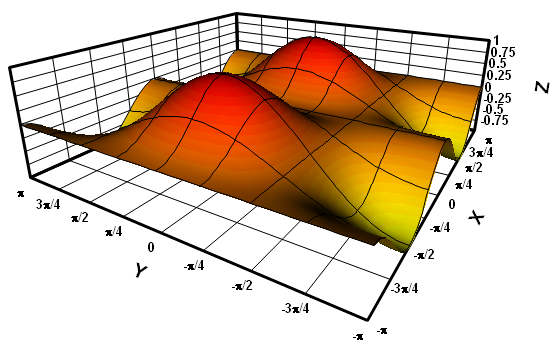
[Contourview(30,20,3)]
See also:
ContourViewChange macro command
Contour Options menu command
Page url:
https://www.dplot.com/help/index.htm?contourviewcommand.htm