|
EX02.GRF |

  
|
|
EX02.GRF |
|
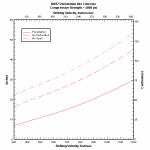
This topic describes how to add X and Y axis labels to the top and right sides of a plot that are dependent on the labels on the bottom and left sides of the plot. This option is useful, for example, for displaying values in two different units.
If you already have an open plot that you would like to try this with, you are of course welcome to use it. Otherwise, open a new document window (select File>New>XY plot), return to this Help window and copy the table below (drag your mouse over the entire table including the headings, right-click and select Copy). Then select Edit>Paste in DPlot.
Striking velocity, feet/sec |
Penetration |
Perforation |
No Spall |
300 |
6.905 |
16.42 |
22.33 |
360 |
8.136 |
18.16 |
24 |
420 |
9.347 |
19.64 |
25.65 |
480 |
10.54 |
21.12 |
27.27 |
540 |
11.72 |
22.59 |
28.87 |
600 |
12.93 |
24.09 |
30.53 |
660 |
14.21 |
25.68 |
32.26 |
720 |
15.59 |
27.38 |
34.13 |
780 |
17.06 |
29.21 |
36.13 |
840 |
18.62 |
31.14 |
38.26 |
900 |
20.28 |
33.2 |
40.51 |
960 |
22.02 |
35.36 |
42.89 |
1020 |
23.86 |
37.64 |
45.38 |
1080 |
25.78 |
40.02 |
48 |
1140 |
27.79 |
42.52 |
50.73 |
1200 |
29.89 |
45.12 |
53.59 |
You'll notice that the headings are correctly interpreted as the X axis label for the first column and legend entries for columns 2 through 4. This works correctly in this case because the table is copied to the clipboard as HTML, so DPlot is able to easily determine where each column heading starts and stops. If the data is only copied to the clipboard as plain text, then column headings containing spaces and/or commas would only be interpreted correctly if they were separated by tab characters or if they were surrounded by "quotation marks".
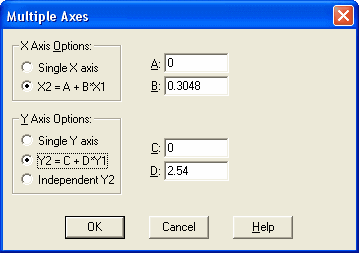
Pasting this data will create 3 new curves, with shared X values from the first column. In this example the amplitudes are in units of inches. So select Text>Title/Axes and enter “Inches” in the Y Axis box. Now… what if we would also like to display tick marks in centimeters? Select Options>Multiple Axes. Under Y Axis Options select Y2 = C + D*Y1. This equation gives a relationship between the numbers on the two axes. One inch is equal to 2.54 centimeters, so in our case the appropriate entries are C=0, D=2.54. If you want to also display the X axis units in meters/second in addition to feet/second, under X Axis Options select X2 = A + B*X1 and enter 0 for A, 0.3048 for B (1 foot = 0.3048 meters).
Click OK, then Text>Title/Axes to enter “Centimeters” in the Alt. Y box and Striking Velocity, meters/sec in the Alt. X box.
This feature can of course be used for other units. To display temperatures in degrees Celsius on the primary axis and degrees Fahrenheit on the secondary axis, for example, use C=32, D=1.8.