|
EX05.GRF |

  
|
|
EX05.GRF |
|
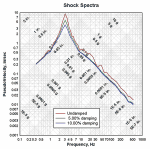
This topic describes how to create a tripartite plot. A tripartite plot (also known as "four coordinate paper") consists of a logarithmic scale on both the X and Y axes and two additional logarithmic scales that are derived from the X and Y axes by some fixed relationship. It is typically used in vibration analyses to determine the peak responses (acceleration, velocity, and displacement) of many different frequency damped, single degree of freedom systems exposed to support motions. Those support motions might be due to earthquakes, explosions, vehicle collisions, etc. Generally a tripartite plot used in this manner will consist of frequency in Hertz on the X axis, psuedo velocity (maximum relative displacement times frequency in radians) on the Y axis, displacement lines at 45 degrees to the X axis, and acceleration lines at 135 degrees to the X axis.
If you already have an open plot that you would like to try this with, you are of course welcome to use that data. Otherwise, open a new document window (select File>New>XY plot), return to this Help window and copy the table below (drag your mouse over the entire table including the headings, right-click and select Copy). Then select Edit>Paste in DPlot.
Frequency, Hz |
Undamped |
5.00% damping |
10.00% damping |
0.333333 |
0.218286 |
0.214353 |
0.210019 |
0.35 |
0.228792 |
0.22449 |
0.219779 |
0.4 |
0.259943 |
0.254452 |
0.248546 |
0.45 |
0.290521 |
0.283721 |
0.276522 |
0.5 |
0.322559 |
0.312257 |
0.30368 |
0.55 |
0.352453 |
0.340024 |
0.329994 |
0.6 |
0.378262 |
0.366991 |
0.355446 |
0.7 |
0.488396 |
0.456718 |
0.427845 |
0.8 |
0.568285 |
0.522135 |
0.482474 |
0.9 |
0.601147 |
0.546691 |
0.502352 |
1 |
0.577336 |
0.567315 |
0.554449 |
1.25 |
0.993687 |
0.900863 |
0.852989 |
1.5 |
1.333305 |
1.233605 |
1.142899 |
2 |
2.399888 |
2.06377 |
1.793627 |
2.5 |
5.359572 |
3.865065 |
2.977338 |
3 |
9.37866 |
5.774712 |
4.089978 |
3.5 |
6.586246 |
4.171359 |
3.056242 |
4 |
3.428447 |
2.579845 |
2.075591 |
4.5 |
2.5476 |
1.928202 |
1.601665 |
5 |
1.741 |
1.50927 |
1.32306 |
5.5 |
1.716137 |
1.321356 |
1.156819 |
6 |
1.333306 |
1.148157 |
1.003342 |
7 |
1.005915 |
0.856357 |
0.743198 |
8 |
0.872728 |
0.634849 |
0.590422 |
9 |
0.577468 |
0.538079 |
0.535213 |
10 |
0.65936 |
0.501782 |
0.49244 |
12.5 |
0.609857 |
0.433688 |
0.414941 |
15 |
0.491792 |
0.376587 |
0.360203 |
20 |
0.45717 |
0.295703 |
0.282438 |
25 |
0.353804 |
0.239117 |
0.228736 |
30 |
0.218888 |
0.197542 |
0.189377 |
35 |
0.172959 |
0.16604 |
0.159524 |
40 |
0.196644 |
0.141818 |
0.136382 |
45 |
0.19477 |
0.123334 |
0.118089 |
50 |
0.158425 |
0.111446 |
0.103643 |
55 |
0.118403 |
0.101482 |
0.094403 |
60 |
0.113993 |
0.092792 |
0.08651 |
70 |
0.111989 |
0.080279 |
0.074763 |
80 |
0.091674 |
0.070345 |
0.065573 |
90 |
0.084288 |
0.063053 |
0.058947 |
100 |
0.073453 |
0.057496 |
0.053711 |
125 |
0.063091 |
0.046978 |
0.044025 |
150 |
0.053322 |
0.038876 |
0.036598 |
200 |
0.035499 |
0.025902 |
0.02425 |
250 |
0.029394 |
0.022213 |
0.020661 |
300 |
0.023711 |
0.0172 |
0.016051 |
350 |
0.019072 |
0.012695 |
0.012572 |
400 |
0.018331 |
0.012627 |
0.011951 |
450 |
0.016375 |
0.012072 |
0.011298 |
511.5 |
0.014466 |
0.010823 |
0.009946 |
This table shows the peak velocity of a single-degree-of-freedom system due to a sinusoidal support motion for several critical damping ratios.
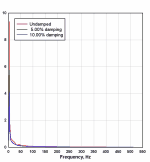
Initially you will see a standard linear X, linear Y plot with large peak values at a small (relative to the extents) frequency:
To switch to a tripartite grid, right-click within the box surrounding the plot and select Tripartite Grid.
Other formatting options for this scale type are available on the right-click menu. In particular, Square Log Cycles will force the plot to be drawn such that the physical distance between cycles on the X axis is identical to the physical distance between log cycles on the Y axis. This option is not shown if you have forced the plot to a specific size using Options>Extents/Intervals/Size.
By default DPlot assumes your input X values are frequency in Hertz, Y values are velocity in inches, and displays acceleration in g's and displacement in inches. Presets for other units are available with the Tripartite Options command on the right-click menu (or Options>Linear/Log Scaling>Tripartite Options on the main menu). For user-defined units not shown on that dialog, please see the Help topic for the Tripartite Options command.