|

  
|
||
| Show/Hide Hidden Items |
|
|
||
| Show/Hide Hidden Items |
Allows you to open a DPlot file (containing data, strings, and formatting information), or one or more of nine other file formats.
Shortcut:
| Click |
| CTRL+O |
| A) | DPlot file Contains data for one or more curves, as well as the title, axis labels, legend, and other formatting information. You may also select this option to open a compressed DPlot file. |
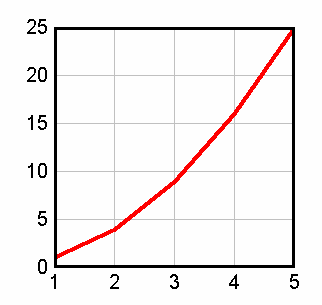
| B) | ASCII file, one or more data sets (X,Y curves) with arbitrarily spaced points. The first line should have the number of points (N). Subsequent lines should contain each of the N X,Y data pairs. Data values may be separated by one or more spaces or a comma. |
5 1. 1. 2. 4. 3. 9. 4. 16. 5. 25. |
|
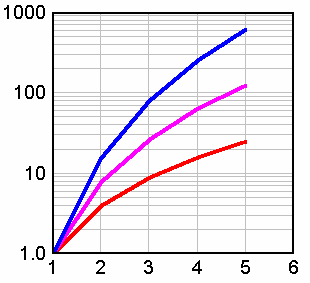
You can include multiple curves by repeating the pattern: The last X,Y pair for curve 1 is followed by N for curve 2, etc.
5 1.00,1.00 2.00,4.00 3.00,9.00 4.00,16.0 5.00,25.0 5 1.00,1.00 2.00,8.00 3.00,27.0 4.00,64.0 5.00,125. 5 1.00,1.00 2.00,16.0 3.00,81.0 4.00,256. 5.00,625. |
|
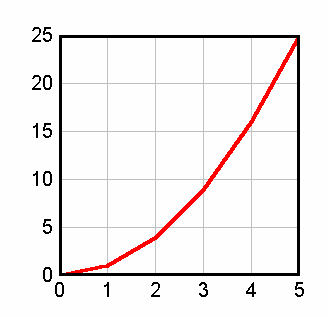
| C) | Constant DX. The number of points (N) and spacing between data points (DX) should be on the same line, or DX should be on the line following N. DPlot will allow up to 3 header lines before the line containing N. If found, those lines will be used as the plot's title lines. The Y values may be on the same line separated by one or more spaces or a comma, or on separate lines. The first X value is assumed to be 0. (This can be amended by selecting 'Add a constant to X' from the 'Edit' menu.) |
6 1. 0. 1. 4. 9. 16. 25. |
|
| D) | Multiple column text files. |
Multiple column text files (type D on the Select File Type dialog) may have columns delimited by commas (CSV files, for example), spaces, tabs, or semicolons. If the decimal symbol is set to a comma, columns should be separated by tabs or semicolons. Files may contain up to 30 header lines preceding the data columns (maximum number of header lines can be increased with the General command on the Options menu). DPlot looks for up to 20 successive lines that have the same number of data columns and the same data type in each column, and, if found, decides that this must be where the data starts. Data values may be separated by one or more spaces, a comma, or a tab. DPlot will read up to a maximum of 100 columns of data, restricted to 8192 characters per line.
Column Headings. If the data starts after line 1, DPlot attempts to get column headings from the previous line. Column headings are used as the legend for multiple curves, or the X and Y axis labels for a single curve. For this feature to work as expected with headings containing spaces, the columns must either be comma-separated, tab-separated, or delineated with double quotation marks. Otherwise DPlot will assume the labels are delineated with spaces.
Title Lines. Up to the first 3 lines in the file are used as title lines for the plot, unless these lines consist of numbers and/or spaces only.
Column Interpretation. If the file consists of a single column of data DPlot interprets the data as Y values, setting the corresponding X values to the index of the Y value in the file, starting from 0. By default, if the file consists of more than one column of data, DPlot uses the first column for the X array and subsequent columns as separate Y arrays. For multiple-column files, and/or for files consisting of alternating X,Y columns, you can change this default behavior by checking the Pick Columns to Plot box (see below) on the Open dialog box.
1.00 1.00 1.00 1.00 2.00 4.00 8.00 16.0 3.00 9.00 27.0 81.0 4.00 16.0 64.0 256. 5.00 25.0 125. 625. |
|
This is the title line X X^2 X^3 X^4 1 1 1 1 2 4 8 16 3 9 27 81 4 16 64 256 5 25 125 625 |
|
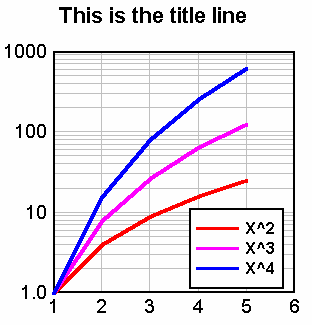
![]() Example (column headings, comma-separated):
Example (column headings, comma-separated):
This is the title line X,X^2,X^3,X^4 1,1,1,1 2,4,8,16 3,9,27,81 4,16,64,256 5,25,125,625 |
|
In addition to numbers DPlot will also accept columns consisting of dates, times, date-time pairs, currencies, and percentages. Date format is flexible but entries must be separated by a dash (-) or forward slash (/). If the month is specified as a number, then DPlot assumes the order is m/d/y (or d/m/y if Assume input dates are of the form d/m/y under the General command on the Options menu is checked) unless you use 4 digit years or if the assumed month entry is greater than 12. These date forms (for Jun 8, 2005) are acceptable:
6/8/05
06/08/2005
6-8-2005
2005/6/8
8-Jun-05
June-08-2005
but 'June 8, 2005' is not.
2-digit years less than 90 are interpreted as 21st century dates; 2-digit years greater than or equal to 90 are interpreted as 20th century dates. Of course, to avoid any ambiguity a 4-digit year is preferable.
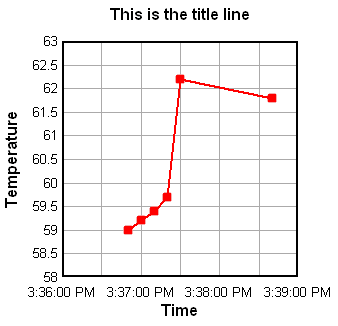
Time values should be in the form h:m:s AM/PM, using ':' as the separator. Leading zeroes are acceptable. If the AM or PM designation is omitted, DPlot assumes a 24 hour clock.
This is the title line "Time","Temperature","Units" 15:36:50,59.0,C 15:37:00,59.2,C 15:37:10,59.4,C 15:37:20,59.7,C 15:37:30,62.2,C 15:38:40,61.8,C |
|
Date-time pairs should be in the form 'm/d/yy h:m:s AM/PM'.
Only dollar signs and British pound signs are currently accepted as currency symbols. The currency symbol should precede the value, as in '$56.23'. If monetary values include a comma for the thousands separator, the entry must be surrounded by double quotation marks. This is the same scheme used by Excel when saving CSV files.
Percentages should be followed by a percent sign (%). DPlot divides the number by 100 and uses Percent number formatting on the associated axis when appropriate.
Any other data type will be ignored, but in general will be allowed. If present, blank entries are ignored. (For this feature to work as expected, columns must be tab-separated or comma-separated). Entries must not contain commas or tabs unless they are surrounded by double quotation marks. (Microsoft Excel generally surrounds values containing commas with double quotation marks when saving to a CSV file.)
Finally, the data rows may be preceded by an ID character string starting in column 1 that distinguishes this line as data. To make use of this feature check the “Data rows have ID string” box on the Open dialog, and enter the text (up to 8 characters) in the corresponding box. This string is preserved from one session to the next, and once you enter the appropriate string you will be able to drag-and-drop these files onto DPlot without the need to check this box each time.
This is the title line X,X^2,X^3,X^4 # 1,1,1,1 # 2,4,8,16 # 3,9,27,81 # 4,16,64,256 # 5,25,125,625 6,7,8,9 This line will be ignored As will all subsequent lines |
|
If the title line(s) or column headings contain commas, the text to be used should start and end with a double quotation mark (").
Files saved by Microsoft Excel as "comma-separated values" can be read into DPlot using this option.
Campbell Scientific datalogger files
For the most part, Campbell Scientific datalogger files are handled identically to CSV and other multiple-column text files, with a couple of exceptions. DPlot determines that a multiple-column text file is a Campbell datalogger file if:
1) The first seven characters in the file are "T0A5", (including the quotes), and
2) The data is determined to start in line 5, and
3) Lines 2 through 4 contain two times as many quotation marks as there are data columns.
If all of the above tests are met, the file is considered a Campbell Scientific datalogger file. The only significant differences in file handling are:
1) The first title line is taken from the second quoted string in the first line (i.e. "T0A5" is ignored). The second title line is taken from the third quoted string in the first line.
2) Legend entries are taken from the second and third lines in the file. If the entries in the third line are not blank, a comma separator is added between the entry from the second line and the entry from the third line.
3) If the column heading for the second column in the second file line is "RECORD", this column is skipped. Normally the 0-based record number is superfluous. If you want the record number to be plotted, you should check the "Pick columns to plot" box.
Allows you to specify which columns within a multiple-column file to plot. Up to 20 rows from the selected file are displayed in the read-only box on the left side of the dialog box. Each column is preceded by a heading with the column number as interpreted by DPlot. If the column numbers do not match up with what you expected, or if the displayed text does not start with the first data line, then DPlot had difficulty in determining either the number of columns or the start of the data, or both. For more information see the description of file type D in the Open Command Help topic.
By default, DPlot uses the first column of data in multi-column files for the X axis values. If there is only one column of data, DPlot starts X at 0 and increments by 1 for each additional row. Subsequent columns (or the first column in single-column files) are used for the Y values, each sharing the same X.
To change the column number used for the X axis values, enter a number in the Use column __ for X Axis box. This entry cannot be a text column. If this number is 0, then DPlot starts X at 0 and increments X by 1 for each additional row of data values.
Select columns to use for the Y values by checking the appropriate check boxes under Use these columns for Y. Note that you cannot select a column to serve as both the X Axis values and the Y values for a curve, nor can you select text columns (anything other than numbers, currencies, dates, times, or date-time pairs).
Alternatively, if the file contains alternating X,Y columns, as in:
X(1,1) Y(1,1) X(1,2) Y(1,2)
X(2,1) Y(2,1) X(2,2) Y(2,2)
X(3,1) Y(3,1) X(3,2) Y(3,2)
etc., then you should check the box labelled Alternating X,Y columns. In this case DPlot will disable the even-numbered (Y) columns. Checking an X column will automatically cause the corresponding Y column to be checked. Alternating X,Y columns cannot be selected if the total number of columns in the file is an odd number, or if the file contains any non-numeric columns.
If you are opening a file via a macro or programmatically (dplotlib.dll) using a FileOpen command and do not want the Specify Columns to Plot dialog to appear, instead using the default settings, use a ColumnsAre command. For example if your file consists of two columns (or 4, 6, 8, etc.) for an XY Plot and you do not want the Specify Columns to Plot dialog to appear, using [ColumnsAre(1)] before the FileOpen command.
Labels
For X,Y data files containing 3 (and only 3) columns or for 3D data files containing 4 columns, you may specify that the last column contains point labels. For example this data:
0.0, 0.000000000,"X=$X, Y=$Y"
0.1, 0.309016994,
0.2, 0.587785252,
0.3, 0.809016994,
0.4, 0.951056516,
0.5, 1.000000000,"X=$X, Y=$Y"
0.6, 0.951056516,
0.7, 0.809016994,
0.8, 0.587785252,
0.9, 0.309016994,
1.0, 0.000000000,"X=$X, Y=$Y"
1.1,-0.309016994,
1.2,-0.587785252,
1.3,-0.809016994,
1.4,-0.951056516,
1.5,-1.000000000,"X=$X, Y=$Y"
1.6,-0.951056516,
1.7,-0.809016994,
1.8,-0.587785252,
1.9,-0.309016994,
2.0, 0.000000000,"X=$X, Y=$Y"
will produce this plot:
Note that this method will always produce a file size of at least 2048 bytes for a single curve (or 1024*(1+number of curves)), regardless of how small the original data set is.
X and Y values are saved as 4-byte (32-bit) floating point values. If precision is important (for example your data has hundreds of thousands of points with a relatively small increment between points), consider using type N. See below.
Files saved by DPlot using this format will always fill the first 1024-byte record with 0’s following the number of points for each curve, which should assist programmers in quickly determining how many curves are present in the file.
If you use the Lahey FORTRAN compiler and you want to read an unformatted file produced by DPlot, you should compile your program with the /D option, which tells the program not to expect the F77L header. Likewise, if your F77L program produces an unformatted file that you want to read with DPlot, the program should be compiled with the /D option.
Other FORTRAN compilers may expect different file formats for unformatted data than that described above.
| F) | Binary file produced by Pacific Data Model 9820 recorders, DNA/Bendix format. Records produced in DNA field tests generally follow this format. See your instrumentation personnel. For more information see the Bendix Format Files Help topic. |
| G) | Binary file produced by Pacific Data recorders, OLD format (pre-1993). For more information see the Pacific Data Recorder Old Format Help topic. |
| H) | Binary file produced by Pacific Data recorders, NEW format (post-1993). For more information see the Pacific Data Recorder New Format Help topic. |
| I) | Nicolet Time Domain files (binary) created with the Nicolet System 400 Digital Oscilloscope. For more information see the Nicolet Waveform File Specification Format Help topic. |
| J) | Hardened Data Acquisition System (HDAS) files. The HDAS is a self-contained transducer/recording system developed by Dr. Ray Franco. For more information see the HDAS File Format Help topic. |
| K) | Random 3D points. ASCII text file containing randomly-spaced 3D points, one X,Y,Z triplet per line. Values may be separated by commas, spaces, or tabs. The file type will result in a new plot window being opened (if the currently active window has a plot). For surface plots, a convex triangular mesh is generated, and each triangle in the mesh is considered planar when drawing contour levels. Areas outside the triangular mesh are not interpolated and not drawn. To delete extraneous triangles see the How To topic "How do I force DPlot to create a triangular mesh of my 3D points that is not convex?". You can generate a smoother plot after reading one of these file with the Generate Mesh command on the Options menu. Also for surface plots, points with identical X,Y coordinates are removed, preserving the point with the maximum Z value. For 3D scatter plots, all points are preserved. For 3D scatter plots, this file format can contain multiple data sets. Data sets are separated by a single blank line. 3D scatter plots saved by DPlot as CSV files will use this same format. |
This file format may optionally contain 3 title lines and X, Y, and Z axis labels preceding the data. If included, these lines should start and end with double-quotation marks. DPlot reads labels in the order 1st title line, 2nd title line, 3rd title line, X axis label, Y axis label, Z axis label. So if you want, for example, to include all axis labels but have only one title line, the 2nd and 3rd lines in the file should be pairs of double-quotation marks. Alternatively, if the X, Y, and Z axis labels are on the same line (such that there are 3 pairs of double quotation marks on this line), DPlot will interpret this line correctly regardless of whether any title lines precede it.
For data files containing 4 (and only 4) columns, you may specify that the last column contains point labels by checking the Pick Columns to Plot box. These labels will only be drawn in 2D views, not 3D views. Labels should be delineated with "double quotation marks".
If you are opening a file via a macro or programmatically (dplotlib.dll) using a FileOpen command and do not want the Specify Columns to Plot dialog to appear, instead using the default settings, use a ColumnsAre command. For example if your file consists of three columns of numbers with X, Y, and Z coming from columns 1, 2, and 3 respectively and you do not want the Specify Columns to Plot dialog to appear, using [ColumnsAre(3)] before the FileOpen command.
| L) | File import plugins. The associated listbox shows plugin modules that you elected to install when running the DPlot setup program. File import plugin modules distributed with DPlot are described in the File Import Plugin Modules topic. To develop your own plugin modules for DPlot, see the Plugins for File Import, Export and Data Manipulation topic. |
| M) | 1D Statistics. ASCII file containing one or more groups of amplitudes. These files produce a box-and-whisker plot or dot graph. The format for this file type is: |
NumGroups
do i = 1,NumGroups
Label
NumPoints
do j = 1,NumPoints
Amplitude(j,I)
end do
end do
Note that this method will always produce a file size of at least 2048 bytes for a single curve (or 1024*(1+number of curves)), regardless of how small the original data set is.
X and Y values are saved as 8-byte (64-bit) floating point values. For a (usually) smaller file size but decreased precision, see type E above.
Files saved by DPlot using this format will always fill the first 1024-byte record with 0’s following the number of points for each curve, which should assist programmers in quickly determining how many curves are present in the file.
If you use the Lahey FORTRAN compiler and you want to read an unformatted file produced by DPlot, you should compile your program with the /D option, which tells the program not to expect the F77L header. Likewise, if your F77L program produces an unformatted file that you want to read with DPlot, the program should be compiled with the /D option.
Other FORTRAN compilers may expect different file formats for unformatted data than that described above.
Array sizes
If the current maximum number of points/curve is less than the number required to read the file, DPlot will attempt to re-allocate the X,Y arrays using the power of 2 greater than or equal to the number of points found in the file, and the number of curves specified in the file. If the re-allocation fails, DPlot presents an error message and/or reads only the allowable number of points.
If, after successfully reading a file, the allocated number of points/curve is greater than twice the number required, DPlot re-allocates the X,Y arrays using the power of 2 greater than or equal to the maximum number of points for all curves.
Multiple file selection
For other than DPlot files, you may read multiple files into the same window. To select multiple files, hold down the CONTROL key while selecting each of the files to read, or press the SHIFT key to select a range of files.
File termination
For each of the supported ASCII file formats, the last line in the file should include a carriage return/line feed sequence.
Time scale
Input time values for binary files (file types F, G, H, I, and J) are automatically shifted to milliseconds, rather than seconds.
|
Related macro commands |
Page url:
https://www.dplot.com/help/index.htm?helpid_open.htm