|
Text Placeholders |

  
|
|
Text Placeholders |
|
You can use placeholder codes in a plot's title lines, axis labels, legend, and notations that will be replaced with the corresponding numeric or text values when the plot is drawn. Codes that are replaced with numbers may also be used in equations with the Y=f(X) and similar commands, as well as in equations within macro/DDE commands. Many codes may be specific to a particular data set or curve, or to the entire plot. All codes are preceded by a dollar sign ($). Placeholder codes and the result of their use is shown below.
Code |
Replaced with |
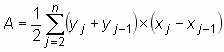
$AREA |
Area under a curve for XY plots. Calculated using the trapezoidal rule:
For 3D and 4D surface plots, $AREA reports the total surface area. |
$FILETITLE |
Text appearing in the window caption of the document, normally the filename of the document if it has been saved. |
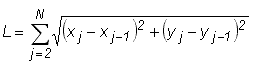
$LENGTH |
Dimensionless length of a curve (XY plots only).
|
$MEAN |
Average amplitude. For 2D data, the average Y value. For 3D data, the average Z value. |
$NEDGE |
Number of exterior edges (3D plots only) |
$NC |
1-based curve index. This shortcut is generally only useful when used in the legend or with the Operate on X or Operate on Y commands on the Edit menu. For example, with Operate on Y, Y=Y+$NC will add 1 to all Y values in the first curve, 2 to all Y values in the second curve, etc. |
$NPTS |
Number of data points |
$NTRI |
Number of triangles (randomly-spaced 3D points only) |
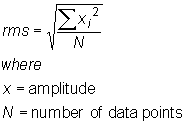
$RMS |
Root-Mean-Square (RMS) of the data amplitudes (Y values for 1D and 2D plots, Z values for 3D data). The RMS is defined by:
|
$SUMX |
Sum of the X values for a curve. (XY plots only) |
$SUMY |
Sum of the Y values for a curve. (XY plots only). Barring overflow errors, should be equal to $MEAN * $NPTS for a given curve. |
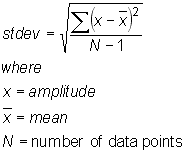
$STDEV |
Standard deviation in the data amplitudes. For 2D data, standard deviation in the Y values. For 3D data, the standard deviation in the Z values.
For MS Excel users, this returns the same value as Excel's STDEVA function. |
X value of the j'th point of the i'th curve. Only meaningful for XY plots. For example, $X(3,12) will be replaced with the X value of the 12th point from the 3rd curve. |
|
Minimum X value. Ignored for box-and-whisker plots and dot graphs. |
|
Maximum X value. Ignored for box-and-whisker plots and dot graphs |
|
Maximum X value minus the minimum X value. |
|
Y value of the j'th point of the i'th curve. Only meaningful for XY plots. For example, $Y(3,12) will be replaced with the Y value of the 12th point from the 3rd curve. |
|
Minimum Y value. |
|
Maximum Y value. |
|
$XYMIN |
XY plots only. The X coordinate where the minimum Y value occurs. |
$XYMAX |
XY plots only. The X coordinate where the maximum Y value occurs. |
$YRANGE |
Maximum Y value minus the minimum Y value. |
$YFIRST |
Y value of the first point in a curve (XY plots only). |
$YLAST |
Y value of the last point in a curve (XY plots only). |
3D/4D plots only: |
|
$ZMIN |
Minimum Z value. |
$ZMAX |
Maximum Z value. |
$ZRANGE |
Maximum Z value minus the minimum Z value. |
$VZMIN |
Minimum visible Z value after zooming or setting extents with Extents/Intervals/Size |
$VZMAX |
Maximum visible Z value after zooming or setting extents. |
$VZAVG |
Average Z value after zooming or setting extents. |
$VXMIN |
Minimum X value after zooming or setting extents. |
$VXMAX |
Maximum X value after zooming or setting extents. |
$VYMIN |
Minimum Y value after zooming or setting extents. |
$VYMAX |
Maximum Y value after zooming or setting extents. |
$=(<equation>) |
Result of evaluating <equation>. For example, “$=(sqrt(5))” will be replaced with “2.23607”. Note that the equation must be enclosed by parentheses. Other text shortcuts that are replaced by a number (i.e. any shortcut other than $FILETITLE) may be used in an equation, as in “$=($STDEV(1)/$MEAN(1))”. For trigonometric functions, the argument is always assumed to be in degrees. This differs a bit from Y=f(X) and other commands that allow a choice between degrees and radians. For more information on equation syntax, operators, and supported functions see the description of the Y=f(X) command. |
Placeholder text IS case-sensitive, e.g. $Xmax will be ignored.
Many of the placeholders may include a numeric argument specifying which data set the placeholder refers to. That numeric argument must be enclosed with parentheses. A 0 argument means that the value for the entire plot (rather than a specific data set) should be used. If the data set argument is omitted, then a context-sensitive decision is made by DPlot about whether the placeholder refers to a specific data set or to the entire plot. For example,
$YMAX when used in a title line or notation will be replaced with the maximum Y value for all data sets. If used in a legend entry, then it will be replaced with the maximum Y value of the data set (curve) associated with that legend entry. To use the maximum Y value for all data sets in a legend entry, then, you must use $YMAX(0) rather than $YMAX.
$YMAX(5) will always be replaced with the maximum Y value from the 5th data set, regardless of where this placeholder is used.
Area ($AREA), mean ($MEAN) and standard deviation ($STDEV) values for aggregate multiple data sets are never calculated. If you use a 0 argument for these values then the placeholder will be replaced with the area, mean or standard deviation for the first data set.
Range
For the $AREA (2D only), $MEAN (2D only), $YMIN, $YMAX, $ZMIN, and $ZMAX placeholders you may include a range of X (or X and Y for $ZMIN, $ZMAX) within which to find those values.
$AREA(<curve number>,<xlo>,<xhi>) returns the area under curve number <curve number> that lies between <xlo> < X < <xhi>.
$MEAN(<curve number>,<xlo>,<xhi>) returns the average amplitude for curve number <curve number> that lies between <xlo> < X < <xhi>. This applies to 2D data only.
$YMIN(<curve number>,<xlo>,<xhi>) returns the minimum Y value for curve number <curve number> that lies between <xlo> < X < <xhi>.
Example: $YMIN(2,1.6,3.5) will be replaced with the minimum Y value between 1.6 < X < 3.5 in the 2nd curve. If no points lie between those extents, the replacement text is "!none found".
$YMAX(<curve number>,<xlo>,<xhi>) returns the maximum Y value for curve number <curve number> that lies between <xlo> < X < <xhi>.
$ZMIN(<data set>,<xlo>,<ylo>,<xhi>,<yhi>) returns the minimum Z value that lies within the bounds <xlo>,<ylo> to <xhi>,<yhi>.
$ZMAX(<data set>,<xlo>,<ylo>,<xhi>,<yhi>) returns the maximum Z value that lies within the bounds <xlo>,<ylo> to <xhi>,<yhi>.
In the context of specifying a range, $YMIN and $YMAX are valid only for XY plots. $ZMIN and $ZMAX are valid only for 3D surface plots and scatter plots. In all cases, the <curve number>/<data set> must be specified. For 3D surface plots this value should always be 1. For XY plots, if <curve number> is set to 0 then the check is against all curves. Similarly, for 3D scatter plots if <data set> is set to 0 then the check is for all data sets.
The range values must be specified using numbers only, not equations and/or other text placeholders.
Please note: Whether because of your default Windows international settings or your personal preference, if you use a comma as a decimal separator then in the placeholder descriptions above that use 2 or more indices, those values should be separated by a semicolon rather than a comma. For example $X(1,1) should be $X(1;1). (If you use a comma as a decimal point then $X(1,1) will be interpreted as $X(1.1), which makes no sense to DPlot.) This is true for menu commands, macros, AND commands sent from another program via dplotlib.dll.
Page url:
https://www.dplot.com/help/index.htm?helpid_text_shortcuts.htm