|

  
|
||
|
|
||
This dialog allows you to specify limits outside which data points will be ignored. Line segments will not be drawn to or from these data points, nor will line segments be drawn between the last and next data points on either side of an ignored point. This allows you to create gaps in your curves. There are several potential uses for this feature; here is one:
The plot below was created using Y=f(X) with Y=tan(X) from PI/4 to 3*PI/4, then zooming in to the limits shown. The only problem with this plot is the vertical line segment between just before X=PI/2 to just after X=PI/2, which has no real meaning.
To eliminate this vertical line, we use Amplitude Limits and set the limits to +/- 200:
As another example, some data sources use amplitudes well outside the limits of any expected results for missing data. For example, you can get temperature data for many locations from http://data.giss.nasa.gov/gistemp/station_data/. Copying and pasting the temperature data for Port Gibson, Mississippi results in this not especially helpful graph:
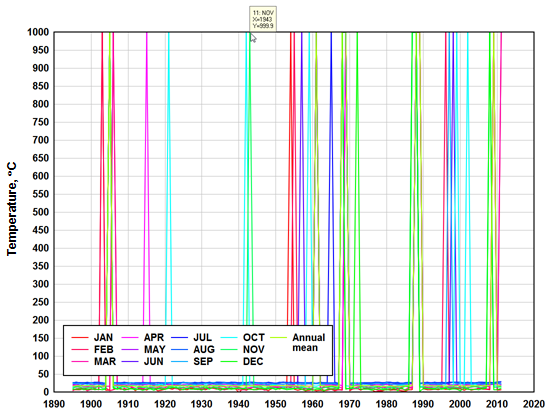
The 999.9 spikes are missing data (temperatures for months with no data are recorded as 999.9, which is hopefully well outside the expected temperature in Mississippi!). You can of course zoom in to the real temperatures, but in this case it would likely be better to simply hide those "no data" points. To hide those points and get a more reasonable plot, you can use Amplitude Limits with the low value set to (in this case) 0 or less and the high value set to 30 or more:
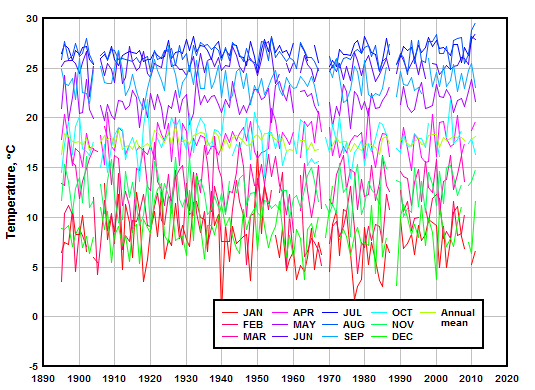
Note that this differs from using Clip Y on the Edit menu, which would delete points outside a specified range but then connect the adjacent points. Amplitude Limits makes gaps in the data much more obvious.
|
Related macro commands |
Page url:
https://www.dplot.com/help/index.htm?helpid_ycutoff.htm