|
How do I find the area under a curve? |

  
|
|
How do I find the area under a curve? |
|
To display the value of the area under a curve, use the $AREA shortcut in any text entry for a plot: a title line, the legend, and/or a notation. When the graph is drawn, $AREA will be replaced with the numeric value. The value will be displayed using the number format for the Y axis.
Use upper case letters for $AREA; e.g. $Area or $area will be ignored.
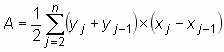
The area is calculated using the trapezoidal rule:
If your document contains more than one curve, add a numeric suffix to $AREA to indicate which curve you want the area under. For example $AREA(3) will be replaced with the area under the 3rd curve. If that suffix is omitted in the legend, then $AREA corresponds to the curve associated with that legend entry. For example $AREA in the legend entry for the second curve is equivalent to $AREA(2).
Example:
with the title of the graph set to "Area under curve=$AREA":
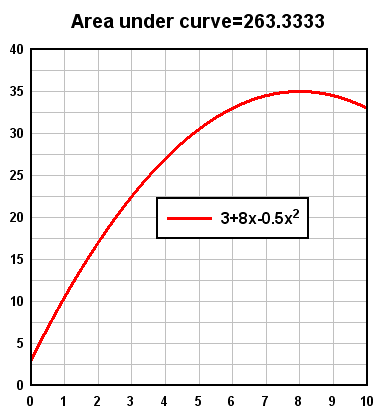
The exact area under the curve
![]()
is given by:
which matches the value replacing the $AREA shortcut. Keep in mind that the trapezoidal rule's accuracy is dependent on the spacing between points; the smaller the spacing, the more closely the trapezoidal rule will come to the rigorous solution.
$AREA may also be used to find an enclosed area, if your curve forms a closed loop. If the curve has a clockwise orientation then $AREA will result in a positive value; if the curve has a counterclockwise orientation then $AREA will be negative. In the following example 3 circles with radius 5 were generated with the X=f(T), Y=g(T) menu command with the spacing in T set to 10, 1, and 0.1 degrees, respectively.
Each legend entry is identical:
$NPTS points, sqrt(Area/{\sp})=$=(sqrt($AREA/PI))