|
How do I create a polar plot? |

  
|
|
How do I create a polar plot? |
|
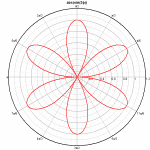
If you want, for example, a polar plot of the equation Y=abs(sin(3*X)) similar to this:
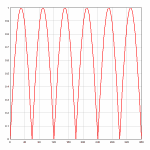
... you'll likely find that when your data is first imported or you use Y=f(X) to generate your data, you get a plot with linear X, linear Y scaling similar to this instead:
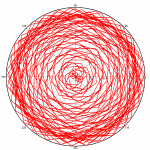
Right-click on the graph and select Polar Coordinates, or select Options>Linear/Log Scaling>Polar Coordinates. When using the Y=f(X) or similar commands, DPlot will automatically correctly set the scale for the angular values to either degrees or radians. If the source of your data is instead a text file or data pasted from the clipboard, then the angular values may be in the wrong units (radians are the default when DPlot is first installed). If the wrong units are assumed, the problem is usually obvious:
This is easily fixed. Right-click on the plot. At the bottom of the dropdown menu, select Polar Plot Options. (This option is also available on the main menu under Options>Linear/Log Scaling). Check degrees under Angular Units. Other formatting options specific to polar plots are also available on this dialog box.
Note that whether the angle input is in degrees or radians, the angular axis labels are in degrees. A handy option for normal linear scales with trigonometric functions or, in our case, polar coordinates is to instead display the angular labels using either multiples of PI or fractional values of PI. Select the Number Formats command on the Options menu, ensure X axis is checked, and in the Format list select “Pi Fractions”.
Take a few moments to experiment with different settings in this dialog. For more information on the Number Formats options, click here.
Page url:
https://www.dplot.com/help/index.htm?how_polar.htm