|
ZGrid Add-In command |

  
|
|
ZGrid Add-In command |
|
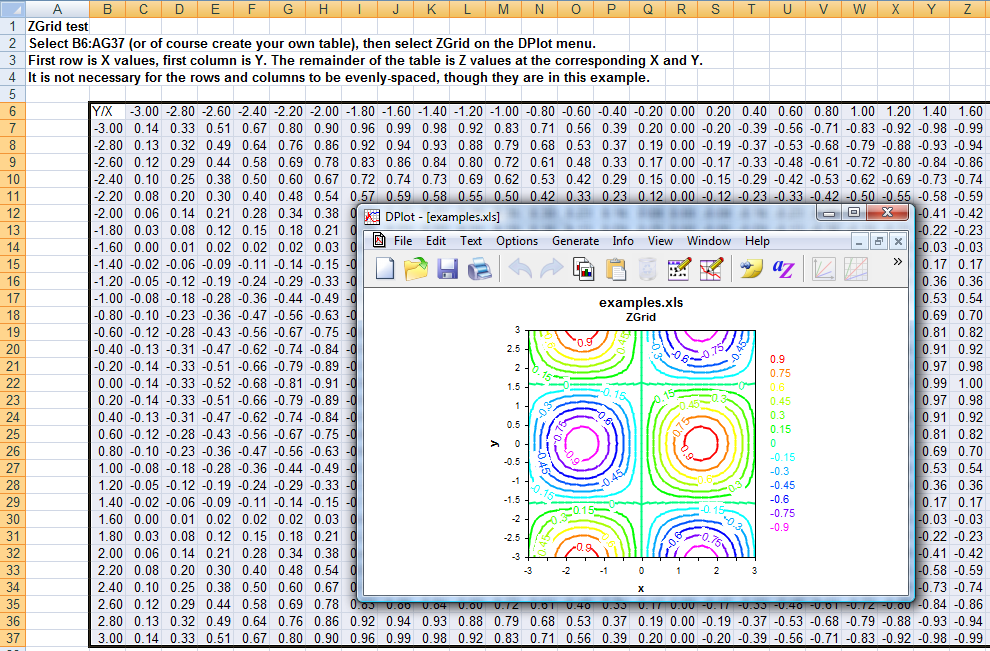
Select a table with X in the first row, Y in the first column, and the remainder of the table filled with Z values for the corresponding X and Y. Produces a 3D surface plot.
Initial plot settings:
Initially the plot will be shown in 2D with contour lines. To show in 3D, draw shaded bands for each contour interval rather than contour lines, change the contour interval or the colors used, right-click outside the plot and select "Contour Options", or select the Contour Options command on the Options menu.
Example:
Page url:
https://www.dplot.com/help/index.htm?zgridcommand.htm