|
How do I set error bars with unique error values? |

  
|
|
How do I set error bars with unique error values? |
|
Three of the four error bar error amount options (see Error Bars command on the Options menu) use some fixed error value or a proportion of the curve's amplitudes. The fourth option, though, allows unique error values at every data point. To make use of this feature first create a new curve whose amplitudes (Y values) are set to the error values. If you want both positive and negative error values and those values should be different, create two new curves: one with the positive error values and the other with the negative error values. The X values of these "curves" are irrelevant: the n'th point in the error source curve(s) will be used as the error value for the n'th point in the selected curve. The source curve(s) for the error values will not be drawn, nor will they be considered when finding a plot's extents. In most dialog boxes that show lists of curves, these error source curves will then generally be shown with a suffix of "(errors)".
Both the positive and negative error values should be positive.
Example:
Select the following table with your mouse, right-click and select Copy, then Paste into DPlot.
X |
The data |
+ Errors |
- Errors |
0.000 |
0.000 |
0.0342 |
0.0910 |
0.167 |
0.500 |
0.0619 |
0.0711 |
0.333 |
0.866 |
0.1060 |
0.0762 |
0.500 |
1.000 |
0.1133 |
0.0352 |
0.667 |
0.866 |
0.0472 |
0.1056 |
0.833 |
0.500 |
0.0666 |
0.0037 |
1.000 |
0.000 |
0.0426 |
0.0649 |
You should end up with a plot resembling the following (extents adjusted for clarity):
Select Error Bars on the Options menu:
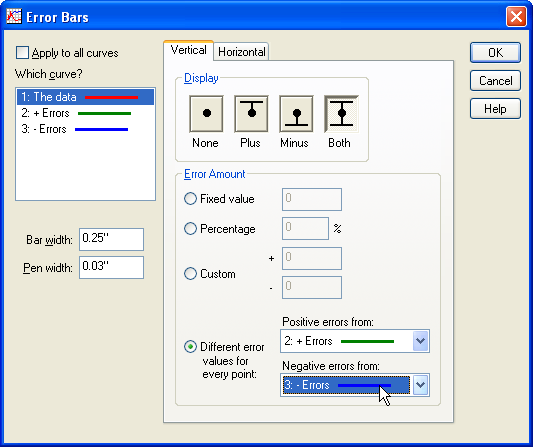
Key points:
| • | Select the first curve (in this example, or whatever curve you want error bars for) under "Which curve?" |
| • | Select "Both" under "Display" if you want both positive and negative error bars. If you want only positive errors, select "Plus", and likewise if you want only negative errors, select "Minus". |
| • | Under "Error Amount" select "Different error values..." and choose the appropriate curves for the positive and negative error values. In our case we've selected the 2nd curve (the 3rd column of values in our original data above) for the positive error values and the 3rd curve for the negative errors. |
| • | Change the "Bar width" and "Pen width" entries to suit your needs, then click OK. |
The result:
If instead of (or in addition to) vertical bars you want horizontal error bars, click the Horizontal tab. You can have both vertical and horizontal error bars on the same curve. The error amplitudes work in the same way: Y values from the error source curves are used for the error values.
Page url:
https://www.dplot.com/help/index.htm?how_errorbars_unique.htm