|
Getting Started with XY Plots - Data From a Disk File |

  
|
| Show/Hide Hidden Items |
|
Getting Started with XY Plots - Data From a Disk File |
|
| Show/Hide Hidden Items |
Select the Open command on the File menu. DPlot currently has direct support for 10 different file formats used for XY plots (types A-J below), plus additional formats supported by any File Import plugins that you might have installed.
Click the Help button on the Select File Type dialog for a full description of each supported file format. DPlot Files are of course files saved by DPlot. Types F-J provide support for files produced by a variety of digital recorders. Chances are if you can use those file formats, you're taking a look at DPlot specifically because of support for those files. By far the most commonly used format when importing data for the first time is type D Multiple columns (2D). This file format includes full support for comma-separated values (CSV) files produced by Microsoft Excel. A full description of DPlot's support for multiple column files, along with several examples, is repeated here (from the Help topic for the Open command):
Multiple column text files (type D on the Select File Type dialog) may have columns delimited by commas (CSV files, for example), spaces, tabs, or semicolons. If the decimal symbol is set to a comma, columns should be separated by tabs or semicolons. Files may contain up to 30 header lines preceding the data columns (maximum number of header lines can be increased with the General command on the Options menu). DPlot looks for up to 20 successive lines that have the same number of data columns and the same data type in each column, and, if found, decides that this must be where the data starts. Data values may be separated by one or more spaces, a comma, or a tab. DPlot will read up to a maximum of 100 columns of data, restricted to 8192 characters per line.
Column Headings. If the data starts after line 1, DPlot attempts to get column headings from the previous line. Column headings are used as the legend for multiple curves, or the X and Y axis labels for a single curve. For this feature to work as expected with headings containing spaces, the columns must either be comma-separated, tab-separated, or delineated with double quotation marks. Otherwise DPlot will assume the labels are delineated with spaces.
Title Lines. Up to the first 3 lines in the file are used as title lines for the plot, unless these lines consist of numbers and/or spaces only.
Column Interpretation. If the file consists of a single column of data DPlot interprets the data as Y values, setting the corresponding X values to the index of the Y value in the file, starting from 0. By default, if the file consists of more than one column of data, DPlot uses the first column for the X array and subsequent columns as separate Y arrays. For multiple-column files, and/or for files consisting of alternating X,Y columns, you can change this default behavior by checking the Pick Columns to Plot box (see below) on the Open dialog box.
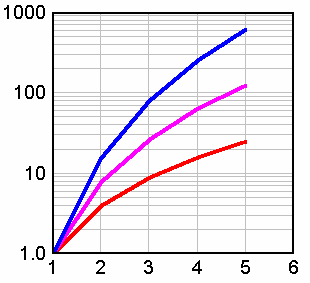
1.00 1.00 1.00 1.00 2.00 4.00 8.00 16.0 3.00 9.00 27.0 81.0 4.00 16.0 64.0 256. 5.00 25.0 125. 625. |
|
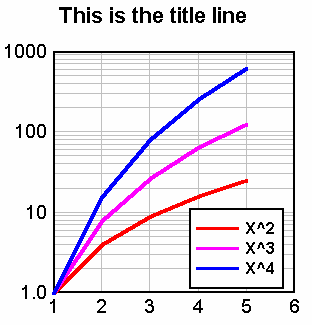
This is the title line X X^2 X^3 X^4 1 1 1 1 2 4 8 16 3 9 27 81 4 16 64 256 5 25 125 625 |
|
![]() Example (column headings, comma-separated):
Example (column headings, comma-separated):
This is the title line X,X^2,X^3,X^4 1,1,1,1 2,4,8,16 3,9,27,81 4,16,64,256 5,25,125,625 |
|
In addition to numbers DPlot will also accept columns consisting of dates, times, date-time pairs, currencies, and percentages. Date format is flexible but entries must be separated by a dash (-) or forward slash (/). If the month is specified as a number, then DPlot assumes the order is m/d/y (or d/m/y if Assume input dates are of the form d/m/y under the General command on the Options menu is checked) unless you use 4 digit years or if the assumed month entry is greater than 12. These date forms (for Jun 8, 2005) are acceptable:
6/8/05
06/08/2005
6-8-2005
2005/6/8
8-Jun-05
June-08-2005
but 'June 8, 2005' is not.
2-digit years less than 90 are interpreted as 21st century dates; 2-digit years greater than or equal to 90 are interpreted as 20th century dates. Of course, to avoid any ambiguity a 4-digit year is preferable.
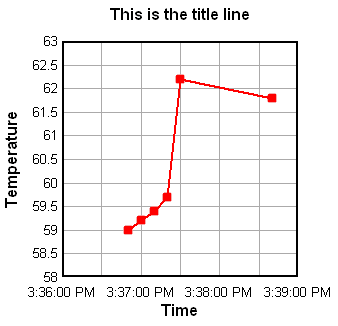
Time values should be in the form h:m:s AM/PM, using ':' as the separator. Leading zeroes are acceptable. If the AM or PM designation is omitted, DPlot assumes a 24 hour clock.
This is the title line "Time","Temperature","Units" 15:36:50,59.0,C 15:37:00,59.2,C 15:37:10,59.4,C 15:37:20,59.7,C 15:37:30,62.2,C 15:38:40,61.8,C |
|
Date-time pairs should be in the form 'm/d/yy h:m:s AM/PM'.
Only dollar signs and British pound signs are currently accepted as currency symbols. The currency symbol should precede the value, as in '$56.23'. If monetary values include a comma for the thousands separator, the entry must be surrounded by double quotation marks. This is the same scheme used by Excel when saving CSV files.
Percentages should be followed by a percent sign (%). DPlot divides the number by 100 and uses Percent number formatting on the associated axis when appropriate.
Any other data type will be ignored, but in general will be allowed. If present, blank entries are ignored. (For this feature to work as expected, columns must be tab-separated or comma-separated). Entries must not contain commas or tabs unless they are surrounded by double quotation marks. (Microsoft Excel generally surrounds values containing commas with double quotation marks when saving to a CSV file.)
Finally, the data rows may be preceded by an ID character string starting in column 1 that distinguishes this line as data. To make use of this feature check the “Data rows have ID string” box on the Open dialog, and enter the text (up to 8 characters) in the corresponding box. This string is preserved from one session to the next, and once you enter the appropriate string you will be able to drag-and-drop these files onto DPlot without the need to check this box each time.
This is the title line X,X^2,X^3,X^4 # 1,1,1,1 # 2,4,8,16 # 3,9,27,81 # 4,16,64,256 # 5,25,125,625 6,7,8,9 This line will be ignored As will all subsequent lines |
|
If the title line(s) or column headings contain commas, the text to be used should start and end with a double quotation mark (").
Files saved by Microsoft Excel as "comma-separated values" can be read into DPlot using this option.
Campbell Scientific datalogger files
For the most part, Campbell Scientific datalogger files are handled identically to CSV and other multiple-column text files, with a couple of exceptions. DPlot determines that a multiple-column text file is a Campbell datalogger file if:
1) The first seven characters in the file are "T0A5", (including the quotes), and
2) The data is determined to start in line 5, and
3) Lines 2 through 4 contain two times as many quotation marks as there are data columns.
If all of the above tests are met, the file is considered a Campbell Scientific datalogger file. The only significant differences in file handling are:
1) The first title line is taken from the second quoted string in the first line (i.e. "T0A5" is ignored). The second title line is taken from the third quoted string in the first line.
2) Legend entries are taken from the second and third lines in the file. If the entries in the third line are not blank, a comma separator is added between the entry from the second line and the entry from the third line.
3) If the column heading for the second column in the second file line is "RECORD", this column is skipped. Normally the 0-based record number is superfluous. If you want the record number to be plotted, you should check the "Pick columns to plot" box.
Allows you to specify which columns within a multiple-column file to plot. Up to 20 rows from the selected file are displayed in the read-only box on the left side of the dialog box. Each column is preceded by a heading with the column number as interpreted by DPlot. If the column numbers do not match up with what you expected, or if the displayed text does not start with the first data line, then DPlot had difficulty in determining either the number of columns or the start of the data, or both. For more information see the description of file type D in the Open Command Help topic.
By default, DPlot uses the first column of data in multi-column files for the X axis values. If there is only one column of data, DPlot starts X at 0 and increments by 1 for each additional row. Subsequent columns (or the first column in single-column files) are used for the Y values, each sharing the same X.
To change the column number used for the X axis values, enter a number in the Use column __ for X Axis box. This entry cannot be a text column. If this number is 0, then DPlot starts X at 0 and increments X by 1 for each additional row of data values.
Select columns to use for the Y values by checking the appropriate check boxes under Use these columns for Y. Note that you cannot select a column to serve as both the X Axis values and the Y values for a curve, nor can you select text columns (anything other than numbers, currencies, dates, times, or date-time pairs).
Alternatively, if the file contains alternating X,Y columns, as in:
X(1,1) Y(1,1) X(1,2) Y(1,2)
X(2,1) Y(2,1) X(2,2) Y(2,2)
X(3,1) Y(3,1) X(3,2) Y(3,2)
etc., then you should check the box labelled Alternating X,Y columns. In this case DPlot will disable the even-numbered (Y) columns. Checking an X column will automatically cause the corresponding Y column to be checked. Alternating X,Y columns cannot be selected if the total number of columns in the file is an odd number, or if the file contains any non-numeric columns.
If you are opening a file via a macro or programmatically (dplotlib.dll) using a FileOpen command and do not want the Specify Columns to Plot dialog to appear, instead using the default settings, use a ColumnsAre command. For example if your file consists of two columns (or 4, 6, 8, etc.) for an XY Plot and you do not want the Specify Columns to Plot dialog to appear, using [ColumnsAre(1)] before the FileOpen command.
Labels
For X,Y data files containing 3 (and only 3) columns or for 3D data files containing 4 columns, you may specify that the last column contains point labels. For example this data:
0.0, 0.000000000,"X=$X, Y=$Y"
0.1, 0.309016994,
0.2, 0.587785252,
0.3, 0.809016994,
0.4, 0.951056516,
0.5, 1.000000000,"X=$X, Y=$Y"
0.6, 0.951056516,
0.7, 0.809016994,
0.8, 0.587785252,
0.9, 0.309016994,
1.0, 0.000000000,"X=$X, Y=$Y"
1.1,-0.309016994,
1.2,-0.587785252,
1.3,-0.809016994,
1.4,-0.951056516,
1.5,-1.000000000,"X=$X, Y=$Y"
1.6,-0.951056516,
1.7,-0.809016994,
1.8,-0.587785252,
1.9,-0.309016994,
2.0, 0.000000000,"X=$X, Y=$Y"
will produce this plot:
Scaling
The default scaling for any new XY plot is linear X, linear Y. You can change the scaling (logarithmic X and/or Y, probability scale, polar chart, bar chart, ternary plot, etc.) by right-clicking within the box surrounding the plot and selecting the scaling option from the drop-down menu. Scaling options are also accessible via the Linear/Log Scaling command on the Options menu.
Symbols/Line Types
To change the symbol type or line type used by a curve, right-click on the curve and select the appropriate symbol and/or line type. Alternatively, select the Symbol/Line Styles command on the Options menu.
Scale Extents, Tick Marks, Plot Size
To change the extents of the X or Y axis, change the tick mark interval used, or to change the physical size of the plot, select Options>Extents/Intervals /Size.
Number Format
To change the number format used on any axis (to dates, date and time groups, multiples of PI, powers of 10, etc.), right-click on any of those numbers and select the appropriate format. To specify that a 1000 separator should be used, to specify the number of decimal places used, or to change the orientation of those numbers, right-click on any of those numbers and select “More number format options...”. Alternatively select the Number Formats command on the Options menu.
Page url:
https://www.dplot.com/help/index.htm?getting_started_with_xy_plots_.htm